Financially Safer Schools
Equipping students with data-rich affordability information

As we head into college application season, counselors around the U.S. are helping students generate a list of institutions that would be a good fit. This is no easy task, given the sheer number of factors involved in this process. For example, students and their families may value specific academic or career pathways, location and accessibility, cost and financial aid, sports or other extracurricular activities, institutional culture, or campus feel, to name just a few. When one considers the many community, regional, and national factors layered on top of what a student or family may prioritize individually, generating a college list that is best for everyone can seem downright overwhelming.
At uAspire, we focus our efforts on helping students overcome financial barriers to college enrollment, persistence, and degree attainment, and we’ve seen for many years how the financial implications of a student’s choice can make an enormous difference in whether students will reach those outcomes. And so, rather than rely on college rankings that we consider unhelpful (e.g., U.S. News & World Report) or existing frameworks (e.g., safety-match-reach), we decided to develop our own.
Beginning in fall 2022, uAspire advisors started recommending that advisees add to their college lists at least one institution that we call "financially safer." Importantly, we never advise students to remove a particular institution from their list; we want to encourage student agency and recognize the various factors at play. We generated these state-level and regional lists of financially safer schools by analyzing a dozen or so publicly-available data points that directly or indirectly relate to college affordability and comparing them to peer institutions; the data are sourced from the College Scorecard which combines data collected by different federal agencies about the colleges and universities.
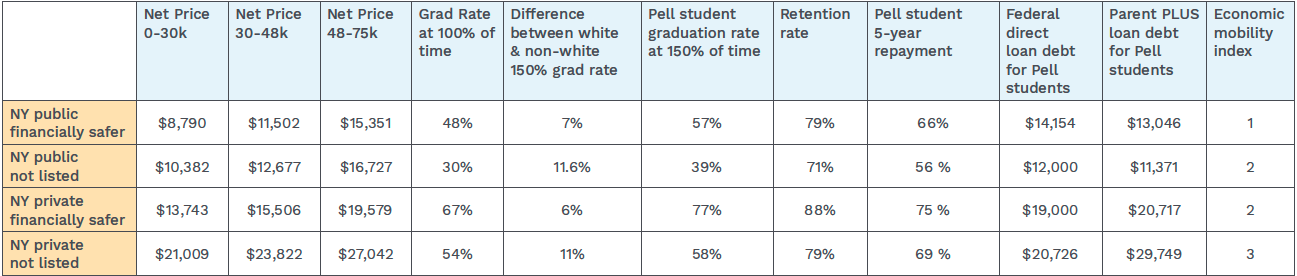
For example, net price helpfully tells a student how much they are likely to be asked to cover with personal savings, earnings from work, or loans. In our model, we included net price metrics among students with reported family incomes below $75,000, since that fit our advising population with greater precision. Using similar logic, we also included debt and repayment metrics among Pell students. Several graduation metrics were included because we reasoned that colleges that manage to graduate a higher percentage of students are a better financial bet. We went a step further to include a race equity metric—the difference in graduation rates between students who identified as white and those who did not—which enables us to privilege institutions that are best supporting BIPOC students toward degree attainment. Finally, we retained an economic mobility indicator, using a formula developed by the think tank Third Way, because it is central to uAspire’s mission.
Table 1, which shows median (or middle) statistics for each data point in our model, offers a comparison between our recommended colleges and those that did not make our list this year. In nearly all cases, students at the recommended institutions are more likely to experience meaningfully better outcomes, from upfront cost to retention and graduation, to loan repayment.
Table 1. Data Explanation for New York Financially Safer Schools
Our recommended New York colleges for 2025-26 are listed below. We separated our analyses by institutional type, ensuring that public and private colleges are not compared against one another. Moreover, the handful of private institutions that indicate they will meet students’ full financial need were noted as such.
City University of New York (CUNY)
- Bernard M Baruch College
- Brooklyn College
- City College
- Hunter College
- John Jay College of Criminal Justice
- Queens College
State University of New York (SUNY)
- Farmingdale State College
- SUNY at Albany
- Binghamton University
- University at Buffalo
- Stony Brook University
- SUNY College of Environmental Science and Forestry
- SUNY Polytechnic Institute
- SUNY Brockport
- SUNY at Fredonia
- SUNY College at Genes
- SUNY New Paltz
- SUNY Oneonta
- SUNY Old Westbury
- SUNY College at Plattsburgh
New York Private Financially Safer Bachelor’s Degree Granting Colleges
- Albany College of Pharmacy and Health Sciences
- Bard College
- Barnard College*
- Canisius University
- Colgate University*
- Columbia University in the City of New York*
- Cornell University*
- Daemen University
- Hamilton College*
- Hobart William Smith Colleges
- Le Moyne College
- New York University
- Niagara University
- Russell Sage College
- Skidmore College*
- St Bonaventure University
- St Lawrence University
- St. Francis College
- St. Joseph's University-New York
- Syracuse University
- The Cooper Union for the Advancement of Science and Art
- Union College*
- University of Mount Saint Vincent
- University of Rochester*
- Vassar College
This year, we've also generated recommendations among the nation’s Historically Black Colleges and Universities (HBCUs) and Hispanic Serving Institutions (HSIs). We made this decision to expand beyond state and regional lists because HBCUs and HSIs may be the first or only choice for some students of color, who are not interested in attending a predominantly white institution (PWI). Moreover, there is strong evidence to suggest that graduates of HBCUs in particular are upwardly mobile, moving from the bottom 40 percent of the income ladder to the top 60 percent at higher rates than PWIs as a group.
Recognizing the tremendous variation among the nation’s nearly 4,000 degree-granting institutions, we at uAspire look forward to enhancing this framework each year with additional indicators of success among students of color, as well as first-generation and low-income populations, and expanding the model to cover institutions in more states and regions. We will know whether we have been successful if more of our advisees are applying to, and enrolling at, those colleges that are likelier to prioritize a student’s financial health and produce graduates with better financial outcomes.
*Meets students’ full financial need which means they guarantee to provide the full amount of financial aid they determine a student needs.
Financially Safer Resources
Financially Safer School Data Explanation
Financially Safer California Schools
Financially Safer Hispanic-Serving Institutions
Financially Safer Historically Black College and Universities
Financially Safer Massachusetts Schools
Financially Safer New York Schools